首页 > 代码库 > 通过案例学习调优之--ADDM
通过案例学习调优之--ADDM
通过案例学习调优之--ADDM使用
应用环境:
操作系统: RedHat EL55
Oracle: Oracle 10gR2
一、ADDM简介
在Oracle9i及之前,DBA们已经拥有了很多很好用的性能分析工具,比如,tkprof、sql_trace、statspack、set event 10046&10053等等。这些工具能够帮助DBA很快的定位性能问题。但这些工具都只给出一些统计数据,然后再由DBA们根据自己的经验进行优化。
那能不能由机器自动在统计数据的基础上给出优化建议呢?Oracle10g中就推出了新的优化诊断工具:数据库自动诊断监视工具(Automatic Database Diagnostic Monitor ADDM)和SQL优化建议工具(SQL Tuning Advisor STA)。这两个工具的结合使用,能使DBA节省大量优化时间,也大大减少了系统宕机的危险。简单点说,ADDM就是收集相关的统计数据到自动工作量知识库(Automatic Workload Repository AWR)中,而STA则根据这些数据,给出优化建议。例如,一个系统资源紧张,出现了明显的性能问题,由以往的办法,做个一个statspack快照,等30分钟,再做一次。查看报告,发现’ db file scattered read’事件在top 5 events里面。根据经验,这个事件一般可能是因为缺少索引、统计分析信息不够新、热表都放在一个数据文件上导致IO争用等原因引起的。根据这些经验,我们需要逐个来定位排除,比如查看语句的查询计划、查看user_tables的last_analysed子段,检查热块等等步骤来最后定位出原因,并给出优化建议。但是,有了STA以后,它就可以根据ADDM采集到的数据直接给出优化建议,甚至给出优化后的语句(抢了DBA的饭碗喽)。
ADDM能发现定位的问题包括:
操作系统内存页入页出问题
由于Oracle负载和非Oracle负载导致的CPU瓶颈问题
导致不同资源负载的Top SQL语句和对象——CPU消耗、IO带宽占用、潜在IO问题、RAC内部通讯繁忙
按照PLSQL和JAVA执行时间排的Top SQL语句.
过多地连接 (login/logoff).
过多硬解析问题——由于shared pool过小、书写问题、绑定大小不适应、解析失败原因引起的。
过多软解析问题
索引查询过多导致资源争用.
由于用户锁导致的过多的等待时间 (通过包dbms_lock加的锁)
由于DML锁导致的过多等待时间(例如锁住表了)
由于管道输出导致的过多等待时间(如通过包dbms_pipe.put进行管道输出)
由于并发更新同一个记录导致的过多等待时间(行级锁等待)
由于ITL不够导致的过多等待时间(大量的事务操作同一个数据块)
系统中过多的commit和rollback(logfile sync事件).
由于磁盘带宽太小和其他潜在问题(如由于logfile太小导致过多的checkpoint,MTTR设置问题,过多的undo操作等等)导致的IO性能问题I
对于DBWR进程写数据块,磁盘IO吞吐量不足
由于归档进程无法跟上redo日至产生的速度,导致系统变慢
redo数据文件太小导致的问题
由于扩展磁盘分配导致的争用
由于移动一个对象的高水位导致的争用问题
内存太小问题——SGA Target, PGA, Buffer Cache, Shared Pool
在一个实例或者一个机群环境中存在频繁读写争用的热块
在一个实例或者一个机群环境中存在频繁读写争用的热对象
RAC环境中内部通讯问题
LMS进程无法跟上导致锁请求阻塞
在RAC环境中由于阻塞和争用导致的实例倾斜
RMAN导致的IO和CPU问题
Streams和AQ问题
资源管理等待事件
有一点要记住:AWR收集的数据时放到内存中(share pool),通过一个新的后台进程MMON定期写到磁盘中。所以10g的share pool要求比以前版本更大,一般推荐比以前大15-20%。另外,还要求系统参数STATISTICS_LEVEL设置为TYPICAL(推荐)或ALL;
ALTER SESSION SET STATISTICS_LEVEL= TYPICAL;
二、案例:
1、采集AWR Snapshot
SQL> begin
  2   dbms_workload_repository.create_snapshot(‘TYPICAL‘);
  3  end;
  4  /
2、运行事务
scott用户执行一个资源消耗高的事务:
15:14:47 SCOTT@ prod>begin
15:34:41   2    for i in 1..1000000 loop
15:34:41   3    execute immediate ‘insert into scott.t1 values (‘||i||‘)‘;
15:34:41   4    end loop;
15:34:41   5    end;
15:34:41   6    /
tom用户同时执行一个资源消耗高的事务:
15:34:45 TOM@ prod>begin
15:34:49   2    for i in 1..1000000 loop
15:34:49   3    execute immediate ‘insert into scott.t1 values (‘||i||‘)‘;
15:34:49   4    end loop;
15:34:49   5    end;
15:34:49   6    /
3、再次采集AWR Snapshot
SQL> begin
  2   dbms_workload_repository.create_snapshot(‘TYPICAL‘);
  3  end;
  4  /
4、查询生成的快照
15:37:57 SYS@ prod> select snap_id,begin_interval_time,end_interval_time from dba_hist_snapshot order by snap_id asc

       190 15-AUG-14 03.18.34.663 PM                15-AUG-14 03.36.36.686 PM
       191 15-AUG-14 03.36.36.686 PM                15-AUG-14 03.37.18.352 PM
       192 15-AUG-14 03.37.18.352 PM                15-AUG-14 03.40.17.649 PM
       193 15-AUG-14 03.40.17.649 PM                15-AUG-14 03.42.38.632 PM
12 rows selected.
5、创建优化任务并执行
15:51:01 SYS@ prod>DECLARE
15:51:57   2      task_name VARCHAR2(30) := ‘DEMO_ADDM03‘;
15:51:57   3      task_desc VARCHAR2(30) := ‘ADDM Feature Test‘;
15:51:57   4      task_id NUMBER;
15:51:57   5  BEGIN
15:51:57   6      dbms_advisor.create_task(‘ADDM‘, task_id, task_name, task_desc, null);
15:51:57   7      dbms_advisor.set_task_parameter(task_name, ‘START_SNAPSHOT‘, 192);
15:51:57   8      dbms_advisor.set_task_parameter(task_name, ‘END_SNAPSHOT‘, 193);
15:51:58   9      dbms_advisor.set_task_parameter(task_name, ‘INSTANCE‘, 1);
15:51:58  10      dbms_advisor.set_task_parameter(task_name, ‘DB_ID‘, 199802235);
15:51:58  11      dbms_advisor.execute_task(task_name);
15:51:58  12  END;
15:51:59  13  /
PL/SQL procedure successfully completed.
其中,set_task_parameter是用来设置任务参数的。START_SNAPSHOT是起始快照ID,END_SNAPSHOT是结束快照ID,INSTANCE是实例号,对于单实例,一般是1,在RAC环境下,可以通过查询视图v$instance得到,DB_ID是数据库的唯一识别号,可以通过查询v$database查到。
6、查看优化建议结果
15:53:18 SYS@ prod>SELECT dbms_advisor.get_task_report(‘DEMO_ADDM03‘,‘TEXT‘, ‘ALL‘) FROM DUAL;
          DETAILED ADDM REPORT FOR TASK ‘DEMO_ADDM03‘ WITH ID 1012
          --------------------------------------------------------
              Analysis Period: 15-AUG-2014 from 15:40:18 to 15:42:39
         Database ID/Instance: 199802235/1
      Database/Instance Names: PROD/prod
                    Host Name: rh55
             Database Version: 10.2.0.1.0
               Snapshot Range: from 192 to 193
                Database Time: 305 seconds
        Average Database Load: 2.2 active sessions
~~~~~~~~~~~~~~~~~~~~~~~~~~~~~~~~~~~~~~~~~~~~~~~~~~~~~~~~~~~~~~~~~~~~~~~~~~~~~~
FINDING 1: 100% impact (305 seconds)
------------------------------------
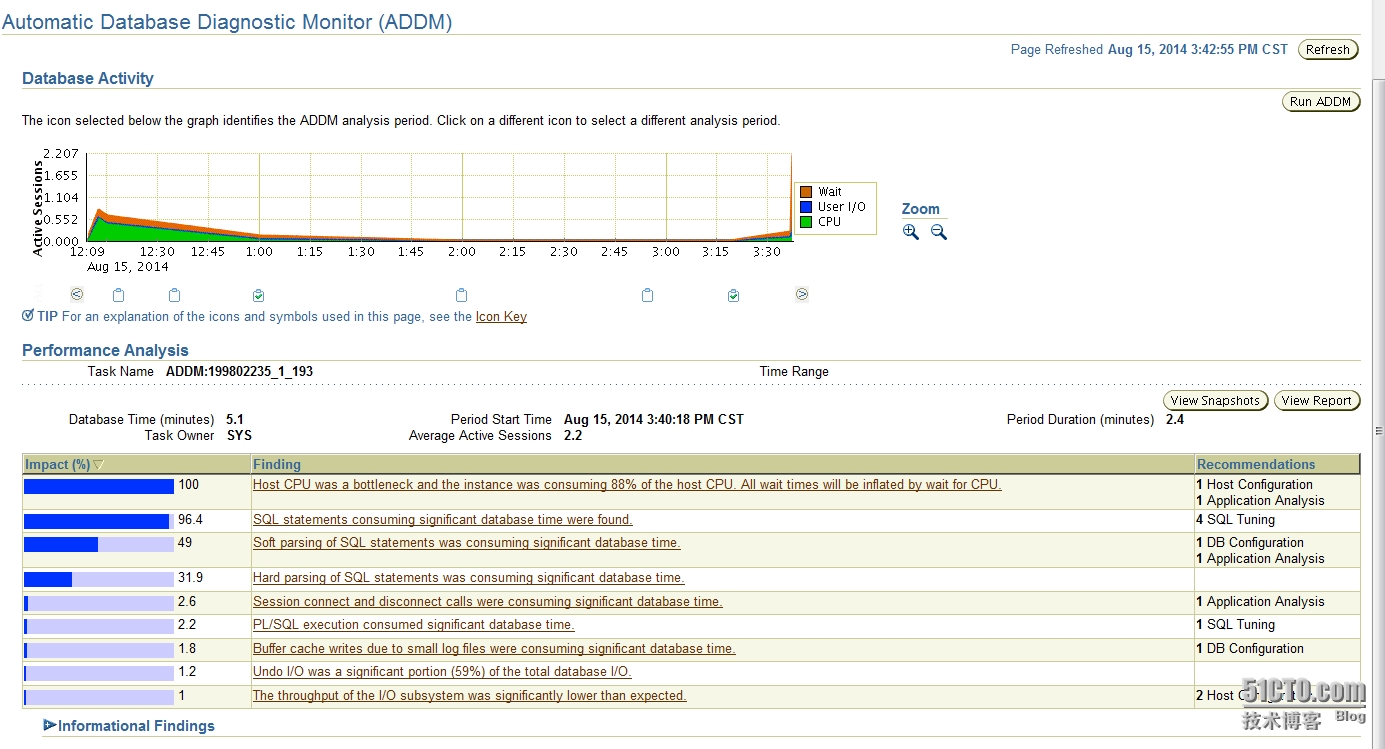
Host CPU was a bottleneck and the instance was consuming 88% of the host CPU.
All wait times will be inflated by wait for CPU.
   RECOMMENDATION 1: Host Configuration, 100% benefit (305 seconds)
      ACTION: Consider adding more CPUs to the host or adding instances
         serving the database on other hosts.
      ACTION: Also consider using Oracle Database Resource Manager to
         prioritize the workload from various consumer groups.
   RECOMMENDATION 2: Application Analysis, 33% benefit (101 seconds)
      ACTION: Parsing SQL statements were consuming significant CPU. Please
         refer to other findings in this task about parsing for further
         details.
   ADDITIONAL INFORMATION:
      Host CPU consumption was 100%.  CPU runqueue statistics are not
      available from the host‘s OS. This disables ADDM‘s ability to estimate
      the impact of this finding.  The instance spent significant time on CPU.
      However, there were no predominant SQL statements responsible for the
      CPU load.
FINDING 2: 96% impact (294 seconds)
-----------------------------------
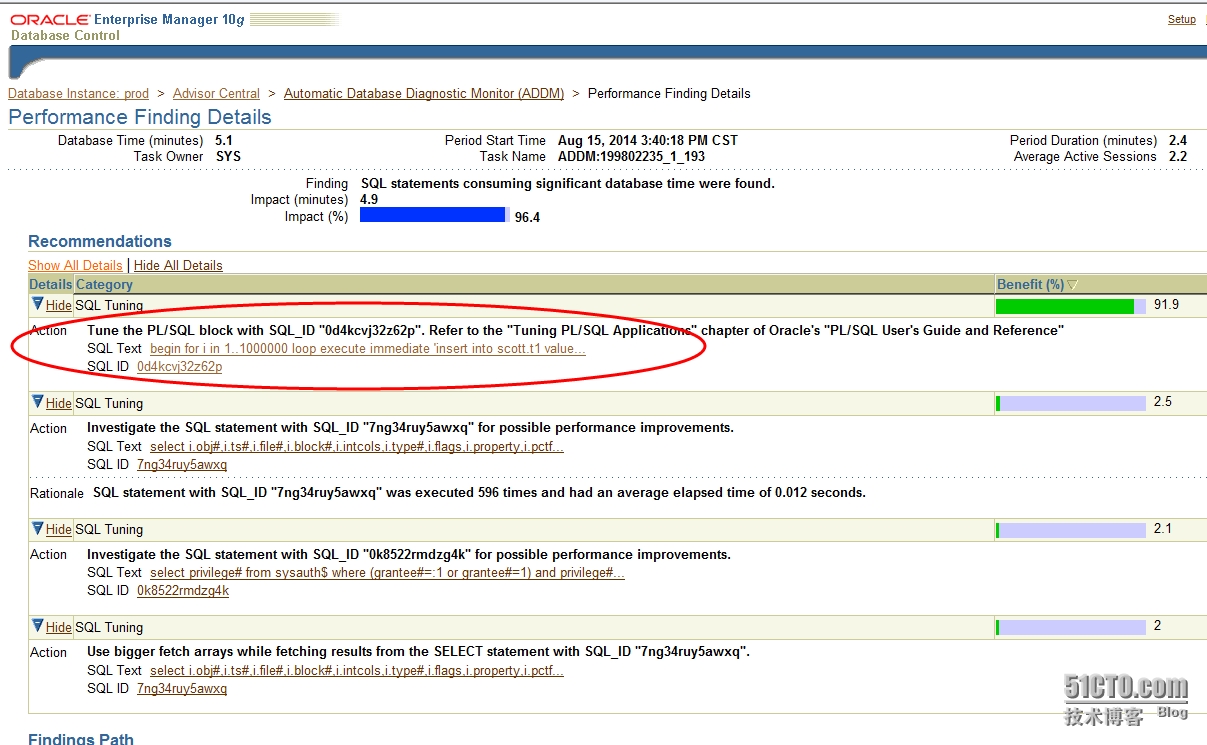
SQL statements consuming significant database time were found.
   RECOMMENDATION 1: SQL Tuning, 92% benefit (280 seconds)
      ACTION: Tune the PL/SQL block with SQL_ID "0d4kcvj32z62p". Refer to the
         "Tuning PL/SQL Applications" chapter of Oracle‘s "PL/SQL User‘s Guide
         and Reference"
         RELEVANT OBJECT: SQL statement with SQL_ID 0d4kcvj32z62p
         begin
         for i in 1..1000000 loop
         execute immediate ‘insert into scott.t1 values (‘||i||‘)‘;
         end loop;
         end;
   RECOMMENDATION 2: SQL Tuning, 2.5% benefit (8 seconds)
      ACTION: Investigate the SQL statement with SQL_ID "7ng34ruy5awxq" for
         possible performance improvements.
         RELEVANT OBJECT: SQL statement with SQL_ID 7ng34ruy5awxq and
         PLAN_HASH 3992920156
         select i.obj#,i.ts#,i.file#,i.block#,i.intcols,i.type#,i.flags,i.prop
         erty,i.pctfree$,i.initrans,i.maxtrans,i.blevel,i.leafcnt,i.distkey,i.
         lblkkey,i.dblkkey,i.clufac,i.cols,i.analyzetime,i.samplesize,i.dataob
         j#,nvl(i.degree,1),nvl(i.instances,1),i.rowcnt,mod(i.pctthres$,256),i
         .indmethod#,i.trunccnt,nvl(c.unicols,0),nvl(c.deferrable#+c.valid#,0)
         ,nvl(i.spare1,i.intcols),i.spare4,i.spare2,i.spare6,decode(i.pctthres
         $,null,null,mod(trunc(i.pctthres$/256),256)),ist.cachedblk,ist.cacheh
         it,ist.logicalread from ind$ i, ind_stats$ ist, (select enabled,
         min(cols) unicols,min(to_number(bitand(defer,1)))
         deferrable#,min(to_number(bitand(defer,4))) valid# from cdef$ where
         obj#=:1 and enabled > 1 group by enabled) c where i.obj#=c.enabled(+)
         and i.obj# = ist.obj#(+) and i.bo#=:1 order by i.obj#
      RATIONALE: SQL statement with SQL_ID "7ng34ruy5awxq" was executed 596
         times and had an average elapsed time of 0.012 seconds.
   RECOMMENDATION 3: SQL Tuning, 2.1% benefit (6 seconds)
      ACTION: Investigate the SQL statement with SQL_ID "0k8522rmdzg4k" for
         possible performance improvements.
         RELEVANT OBJECT: SQL statement with SQL_ID 0k8522rmdzg4k and
         PLAN_HASH 2057665657
         select privilege# from sysauth$ where (grantee#=:1 or grantee#=1) and
         privilege#>0
   RECOMMENDATION 4: SQL Tuning, 2% benefit (6 seconds)
      ACTION: Use bigger fetch arrays while fetching results from the SELECT
         statement with SQL_ID "7ng34ruy5awxq".
         RELEVANT OBJECT: SQL statement with SQL_ID 7ng34ruy5awxq and
         PLAN_HASH 3992920156
         select i.obj#,i.ts#,i.file#,i.block#,i.intcols,i.type#,i.flags,i.prop
         erty,i.pctfree$,i.initrans,i.maxtrans,i.blevel,i.leafcnt,i.distkey,i.
         lblkkey,i.dblkkey,i.clufac,i.cols,i.analyzetime,i.samplesize,i.dataob
         j#,nvl(i.degree,1),nvl(i.instances,1),i.rowcnt,mod(i.pctthres$,256),i
         .indmethod#,i.trunccnt,nvl(c.unicols,0),nvl(c.deferrable#+c.valid#,0)
         ,nvl(i.spare1,i.intcols),i.spare4,i.spare2,i.spare6,decode(i.pctthres
         $,null,null,mod(trunc(i.pctthres$/256),256)),ist.cachedblk,ist.cacheh
         it,ist.logicalread from ind$ i, ind_stats$ ist, (select enabled,
         min(cols) unicols,min(to_number(bitand(defer,1)))
         deferrable#,min(to_number(bitand(defer,4))) valid# from cdef$ where
         obj#=:1 and enabled > 1 group by enabled) c where i.obj#=c.enabled(+)
         and i.obj# = ist.obj#(+) and i.bo#=:1 order by i.obj#
FINDING 3: 49% impact (149 seconds)
-----------------------------------
Soft parsing of SQL statements was consuming significant database time.
   RECOMMENDATION 1: Application Analysis, 49% benefit (149 seconds)
      ACTION: Investigate application logic to keep open the frequently used
         cursors. Note that cursors are closed by both cursor close calls and
         session disconnects.
   RECOMMENDATION 2: DB Configuration, 49% benefit (149 seconds)
      ACTION: Consider increasing the maximum number of open cursors a session
         can have by increasing the value of parameter "open_cursors".
      ACTION: Consider increasing the session cursor cache size by increasing
         the value of parameter "session_cached_cursors".
      RATIONALE: The value of parameter "open_cursors" was "300" during the
         analysis period.
      RATIONALE: The value of parameter "session_cached_cursors" was "20"
         during the analysis period.
   SYMPTOMS THAT LED TO THE FINDING:
      SYMPTOM: Contention for latches related to the shared pool was consuming
               significant database time. (12% impact [36 seconds])
         INFO: Waits for "latch: library cache" amounted to 11% of database
               time.
         SYMPTOM: Wait class "Concurrency" was consuming significant database
                  time. (13% impact [39 seconds])
FINDING 4: 32% impact (97 seconds)
----------------------------------
Hard parsing of SQL statements was consuming significant database time.
   NO RECOMMENDATIONS AVAILABLE
   ADDITIONAL INFORMATION:
      Hard parses due to cursor environment mismatch were not consuming
      significant database time.
      Hard parsing SQL statements that encountered parse errors was not
      consuming significant database time.
      Hard parses due to literal usage and cursor invalidation were not
      consuming significant database time.
      The SGA was adequately sized.
   SYMPTOMS THAT LED TO THE FINDING:
      SYMPTOM: Contention for latches related to the shared pool was consuming
               significant database time. (12% impact [36 seconds])
         INFO: Waits for "latch: library cache" amounted to 11% of database
               time.
         SYMPTOM: Wait class "Concurrency" was consuming significant database
                  time. (13% impact [39 seconds])
FINDING 5: 2.6% impact (8 seconds)
----------------------------------
Session connect and disconnect calls were consuming significant database time.
   RECOMMENDATION 1: Application Analysis, 2.6% benefit (8 seconds)
      ACTION: Investigate application logic for possible reduction of connect
         and disconnect calls. For example, you might use a connection pool
         scheme in the middle tier.
FINDING 6: 2.2% impact (7 seconds)
----------------------------------
PL/SQL execution consumed significant database time.
   RECOMMENDATION 1: SQL Tuning, 2.2% benefit (7 seconds)
      ACTION: Tune the PL/SQL block with SQL_ID "0d4kcvj32z62p". Refer to the
         "Tuning PL/SQL Applications" chapter of Oracle‘s "PL/SQL User‘s Guide
         and Reference"
         RELEVANT OBJECT: SQL statement with SQL_ID 0d4kcvj32z62p
         begin
         for i in 1..1000000 loop
         execute immediate ‘insert into scott.t1 values (‘||i||‘)‘;
         end loop;
         end;
FINDING 7: 1.8% impact (5 seconds)
----------------------------------
Buffer cache writes due to small log files were consuming significant database
time.
   RECOMMENDATION 1: DB Configuration, 1.8% benefit (5 seconds)
      ACTION: Increase the size of the log files to 188 M to hold at least 20
         minutes of redo information.
   SYMPTOMS THAT LED TO THE FINDING:
      SYMPTOM: The throughput of the I/O subsystem was significantly lower
               than expected. (1% impact [3 seconds])
         SYMPTOM: Wait class "User I/O" was consuming significant database
                  time. (2.1% impact [6 seconds])
FINDING 8: 1.2% impact (4 seconds)
----------------------------------
Undo I/O was a significant portion (59%) of the total database I/O.
   NO RECOMMENDATIONS AVAILABLE
   SYMPTOMS THAT LED TO THE FINDING:
      SYMPTOM: The throughput of the I/O subsystem was significantly lower
               than expected. (1% impact [3 seconds])
         SYMPTOM: Wait class "User I/O" was consuming significant database
                  time. (2.1% impact [6 seconds])
FINDING 9: 1% impact (3 seconds)
--------------------------------
The throughput of the I/O subsystem was significantly lower than expected.
   RECOMMENDATION 1: Host Configuration, 1% benefit (3 seconds)
      ACTION: Consider increasing the throughput of the I/O subsystem.
         Oracle‘s recommended solution is to stripe all data file using the
         SAME methodology. You might also need to increase the number of disks
         for better performance. Alternatively, consider using Oracle‘s
         Automatic Storage Management solution.
      RATIONALE: During the analysis period, the average data files‘ I/O
         throughput was 18 K per second for reads and 74 K per second for
         writes. The average response time for single block reads was 19
         milliseconds.
   RECOMMENDATION 2: Host Configuration, 1% benefit (3 seconds)
      ACTION: The performance of file
         /u01/app/oracle/oradata/prod/system01.dbf was significantly worse
         than other files. If striping all files using the SAME methodology is
         not possible, consider striping this file over multiple disks.
         RELEVANT OBJECT: database file
         "/u01/app/oracle/oradata/prod/system01.dbf"
      RATIONALE: The average response time for single block reads for this
         file was 20 milliseconds.
   SYMPTOMS THAT LED TO THE FINDING:
      SYMPTOM: Wait class "User I/O" was consuming significant database time.
               (2.1% impact [6 seconds])
~~~~~~~~~~~~~~~~~~~~~~~~~~~~~~~~~~~~~~~~~~~~~~~~~~~~~~~~~~~~~~~~~~~~~~~~~~~~~~
          ADDITIONAL INFORMATION
          ----------------------
Wait class "Application" was not consuming significant database time.
Wait class "Commit" was not consuming significant database time.
Wait class "Configuration" was not consuming significant database time.
Wait class "Network" was not consuming significant database time.
The analysis of I/O performance is based on the default assumption that the
average read time for one database block is 10000 micro-seconds.
~~~~~~~~~~~~~~~~~~~~~~~~~~~~~~~~~~~~~~~~~~~~~~~~~~~~~~~~~~~~~~~~~~~~~~~~~~~~~~
          TERMINOLOGY
          -----------
DATABASE TIME: This is the ADDM‘s measurement of throughput. From the user‘s
   point of view: this is the total amount of time spent by users waiting for
   a response from the database after issuing a call (not including
   networking). From the database instance point of view: this is the total
   time spent by forground processes waiting for a database resource (e.g.,
   read I/O), running on the CPU and waiting for a free CPU (run-queue). The
   target of ADDM analysis is to reduce this metric as much as possible,
   thereby reducing the instance‘s response time.
AVERAGE DATABASE LOAD: At any given time we can count how many users (also
   called ‘Active Sessions‘) are waiting for an answer from the instance. This
   is the ADDM‘s measurement for instance load. The ‘Average Database Load‘ is
   the average of the the load measurement taken over the entire analysis
   period. We get this number by dividing the ‘Database Time‘ by the analysis
   period. For example, if the analysis period is 30 minutes and the ‘Database
   Time‘ is 90 minutes, we have an average of 3 users waiting for a response.
IMPACT: Each finding has an ‘Impact‘ associated with it. The impact is the
   portion of the ‘Database Time‘ the finding deals with. If we assume that
   the problem described by the finding is completely solved, then the
   ‘Database Time‘ will be reduced by the amount of the ‘Impact‘.
BENEFIT: Each recommendation has a ‘benefit‘ associated with it. The ADDM
   analysis estimates that the ‘Database Time‘ can be reduced by the ‘benefit‘
   amount if all the actions of the recommendation are performed.
Elapsed: 00:00:00.51
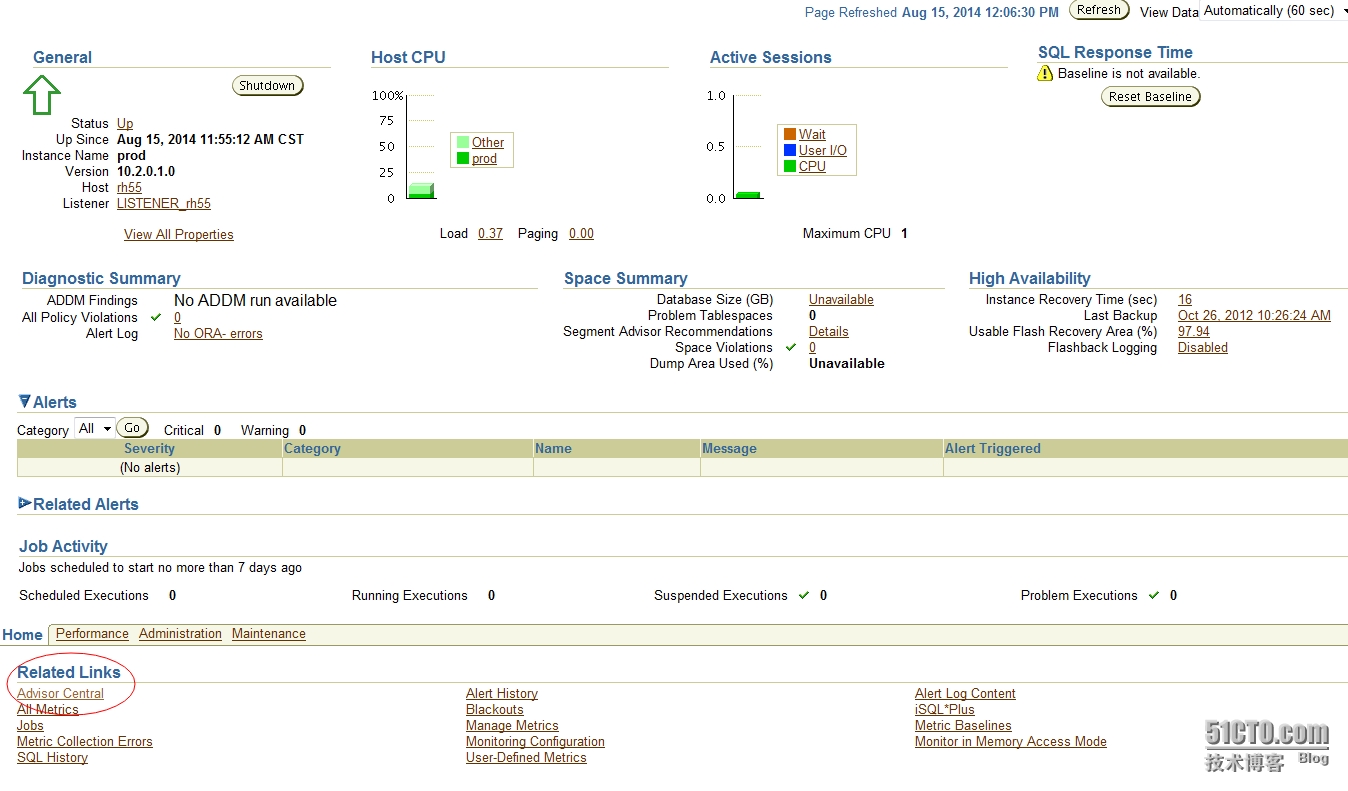
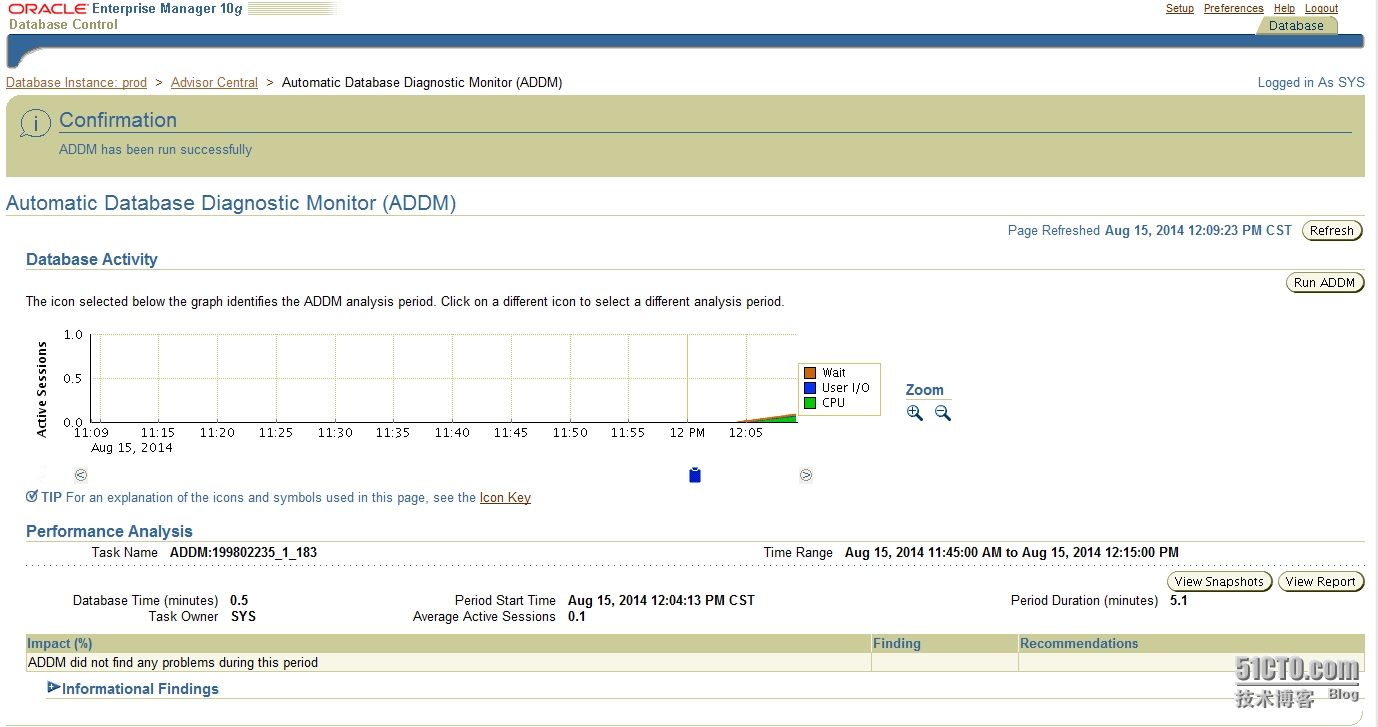
通过OEM查看的诊断结果:
1、启动OEM服务
[oracle@rh55 ~]$ lsnrctl status
LSNRCTL for Linux: Version 10.2.0.1.0 - Production on 15-AUG-2014 11:59:19
Copyright (c) 1991, 2005, Oracle.  All rights reserved.
Connecting to (DESCRIPTION=(ADDRESS=(PROTOCOL=TCP)(HOST=rh55)(PORT=1521)))
STATUS of the LISTENER
------------------------
Alias                     LISTENER
Version                   TNSLSNR for Linux: Version 10.2.0.1.0 - Production
Start Date                15-AUG-2014 11:56:16
Uptime                    0 days 0 hr. 3 min. 3 sec
Trace Level               off
Security                  ON: Local OS Authentication
SNMP                      OFF
Listener Parameter File   /u01/app/oracle/product/10.2.0/db_1/network/admin/listener.ora
Listener Log File         /u01/app/oracle/product/10.2.0/db_1/network/log/listener.log
Listening Endpoints Summary...
  (DESCRIPTION=(ADDRESS=(PROTOCOL=tcp)(HOST=rh55)(PORT=1521)))
  (DESCRIPTION=(ADDRESS=(PROTOCOL=ipc)(KEY=EXTPROC0)))
Services Summary...
Service "PLSExtProc" has 1 instance(s).
  Instance "PLSExtProc", status UNKNOWN, has 1 handler(s) for this service...
Service "prod" has 1 instance(s).
  Instance "prod", status READY, has 1 handler(s) for this service...
Service "prodXDB" has 1 instance(s).
  Instance "prod", status READY, has 1 handler(s) for this service...
Service "prod_XPT" has 1 instance(s).
  Instance "prod", status READY, has 1 handler(s) for this service...
The command completed successfully
[oracle@rh55 ~]$
[oracle@rh55 ~]$ cat /etc/hosts
# Do not remove the following line, or various programs
# that require network functionality will fail.
127.0.0.1                localhost
::1             localhost6.localdomain6 localhost6
192.168.8.239   rh55
192.168.8.12  rac1-vip
192.168.8.13  rac2-vip
[oracle@rh55 ~]$ emctl start dbconsole
TZ set to PRC
Oracle Enterprise Manager 10g Database Control Release 10.2.0.1.0
Copyright (c) 1996, 2005 Oracle Corporation.  All rights reserved.
http://rh55:1158/em/console/aboutApplication
Starting Oracle Enterprise Manager 10g Database Control ................. started.
------------------------------------------------------------------
Logs are generated in directory /u01/app/oracle/product/10.2.0/db_1/rh55_prod/sysman/log
[oracle@rh55 ~]$ netstat -an |grep :1158
tcp        0      0 0.0.0.0:1158                0.0.0.0:*                   LISTEN
tcp        0      0 192.168.8.239:25766         192.168.8.239:1158          TIME_WAIT
2、连接OEM
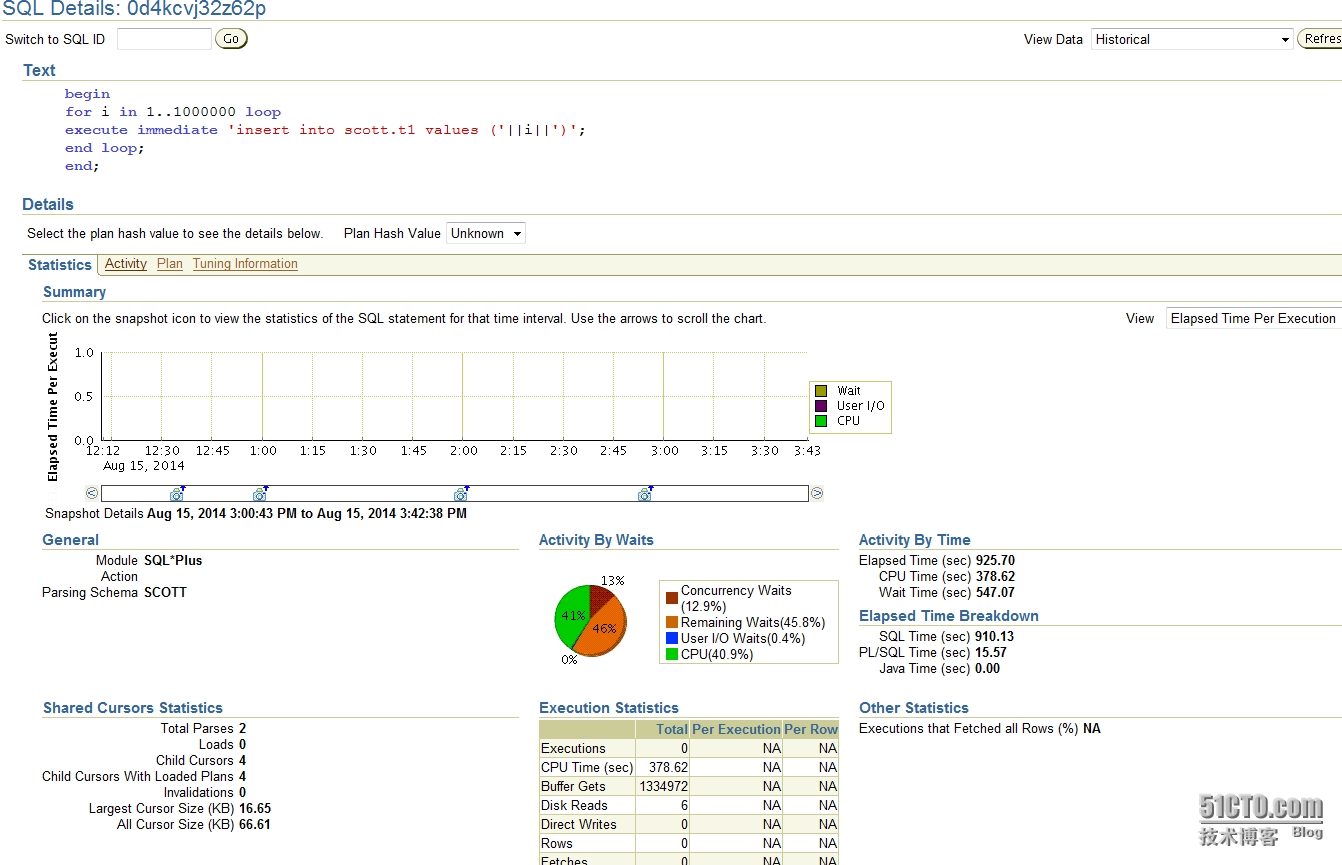
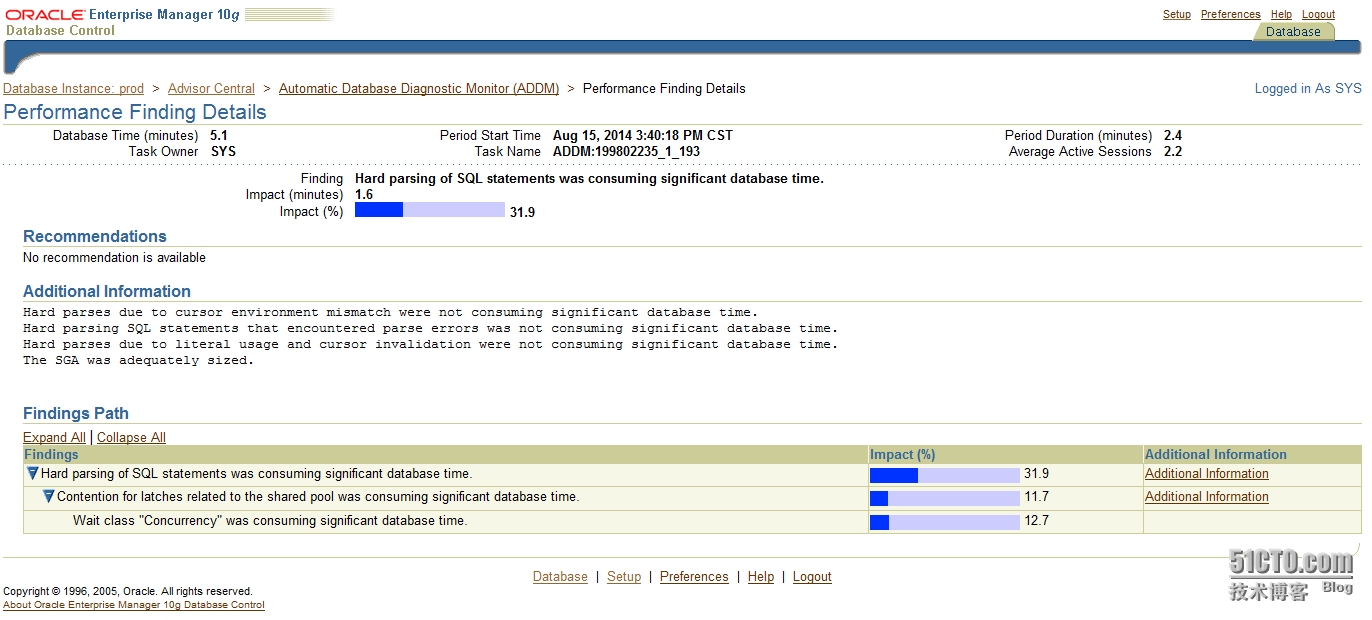
本文出自 “天涯客的blog” 博客,请务必保留此出处http://tiany.blog.51cto.com/513694/1540685
