首页 > 代码库 > 一个监控系统性能的脚本
一个监控系统性能的脚本
[root@localhost ~]# cat monitor.sh
#!/bin/bash
# chkconfig: 2345 08 92
# description: The scripts is to monitor system health !
Today=`date +%Y%m%d`
function disk {
clear
df -h
}
function memory {
clear
free -m
}
function cpu {
clear
top
}
function process {
clear
process_nu=`lsof|wc -l`
echo "The current process numbers is $process_nu" !
}
function ipaddress {
clear
ipaddr=`ifconfig eth0|awk ‘/inet addr/ {print $2}‘|awk -F‘:‘ ‘{print $2}‘`
echo "This server ip address is $ipaddr" !
}
function disk_io {
clear
diskblockin=`vmstat |sed 1d|sed 1d|awk ‘{print $9}‘`
diskblockout=`vmstat |sed 1d|sed 1d|awk ‘{print $10}‘`
echo "The block equipment received $diskblockin blocks one second !"
echo "The block equipment send $diskblockout blocks one second !"
}
function current_time {
clear
current_time=`date|awk ‘{print $5}‘`
echo "The current time is $current_time o clock !"
}
function users {
clear
current_user=`who|wc -l`
echo "There are $current_user users login in the system !"
}
function networkcardflow {
clear
receive1=`cat /proc/net/dev|grep eth0|awk ‘{print $2}‘`
send1=`cat /proc/net/dev|grep eth0|awk ‘{print $10}‘`
sleep 5
receive2=`cat /proc/net/dev|grep eth0|awk ‘{print $2}‘`
send2=`cat /proc/net/dev|grep eth0|awk ‘{print $10}‘`
receive_cnt=`expr $receive2 - $receive1`
receive_cnt=`expr $receive_cnt / 40`
send_cnt=`expr $send2 - $send1`
send_cnt=`expr $send_cnt / 40`
echo "The networkcard flow Input is $receive_cnt bps per second !"
echo "The networkcard flow Ouput is $send_cnt bps per second |"
}
function menu {
clear
echo
echo -e "\t\t\tSystem Admin Menu\n"
echo -e "\t1. Display disk space"
echo -e "\t2. Display memory usage"
echo -e "\t3. Display cpu usage"
echo -e "\t4. Display process statistics"
echo -e "\t5. Display ip address"
echo -e "\t6. Display disk io information"
echo -e "\t7. Display current time"
echo -e "\t8. Display current users"
echo -e "\t9. Display networkcard flow"
echo -e "\t0. Exit program\n\n"
echo -en "\t\tEnter option: "
read -n 1 option
}
while true
do
menu
case $option in
0)
break ;;
1)
disk ;;
2)
memory ;;
3)
cpu ;;
4)
process ;;
5)
ipaddress ;;
6)
disk_io ;;
7)
current_time ;;
8)
users ;;
9)
networkcardflow ;;
*)
clear
echo "Sorry , wrong selection !"
esac
echo -en "\n\n\t\t\tHit any key to continue"
read -n 1 line
done
clear
chmod +x monitor.sh
执行显示效果如下:

可以输入自己的选项,显示相应的结果:
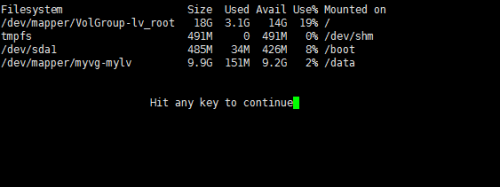
比如输入 1
显示如下:

本文出自 “服务器运维” 博客,请务必保留此出处http://shamereedwine.blog.51cto.com/5476890/1911284
一个监控系统性能的脚本
